
Rumors of a launch for Ethereum spot ETFs next week constitute a sword of Damocles that now hangs over the price of Ether. It offers short-term resilience, but it could penalize price action in the event of disappointment. Let’s see where we are technically on the 2nd cryptocurrency on the market.
It is Wednesday June 26, 2024 and the price of ETH is moving around $3,400.
Ether Ethereum is showing good resistance in the corrective phase that the crypto market has been experiencing in recent weeks. Rumors of a launch of Ethereum spot ETFs at the beginning of July could constitute fundamental data taken into account by the market, explaining the good performance of the ETH price.
The week we are going through should be key for the future. Indeed, Sunday’s closing coincides with the monthly, quarterly and half-yearly closings. It is also a week full of macroeconomic and political events:
- Thursday will be published the final figure of the US GDP, it is also the day of first political debate between the 2 candidates for the next American elections. As cryptos have joined the debate, we could observe market reactions following this event;
- the PCE inflation figure will be published Friday at 2:30 p.m. Paris time. This figure must confirm a trend towards deflation to maintain good momentum on risky assets.
Let’s see in this context what technical state Ethereum is in heading into these events.
Cryptoast Research: Don’t waste this bull run, surround yourself with expertsEthereum at work on its polarity zone
| Pairs with Ethereum | 24 hours | 7 days | 1 month |
| Ethereum/USDT | +0.80% | -6.00% | -13.60% |
| Ethereum/Bitcoin | -0.20% | +1.50% | -3.50% |
👉 How to easily buy Ethereum (ETH) in 2024?
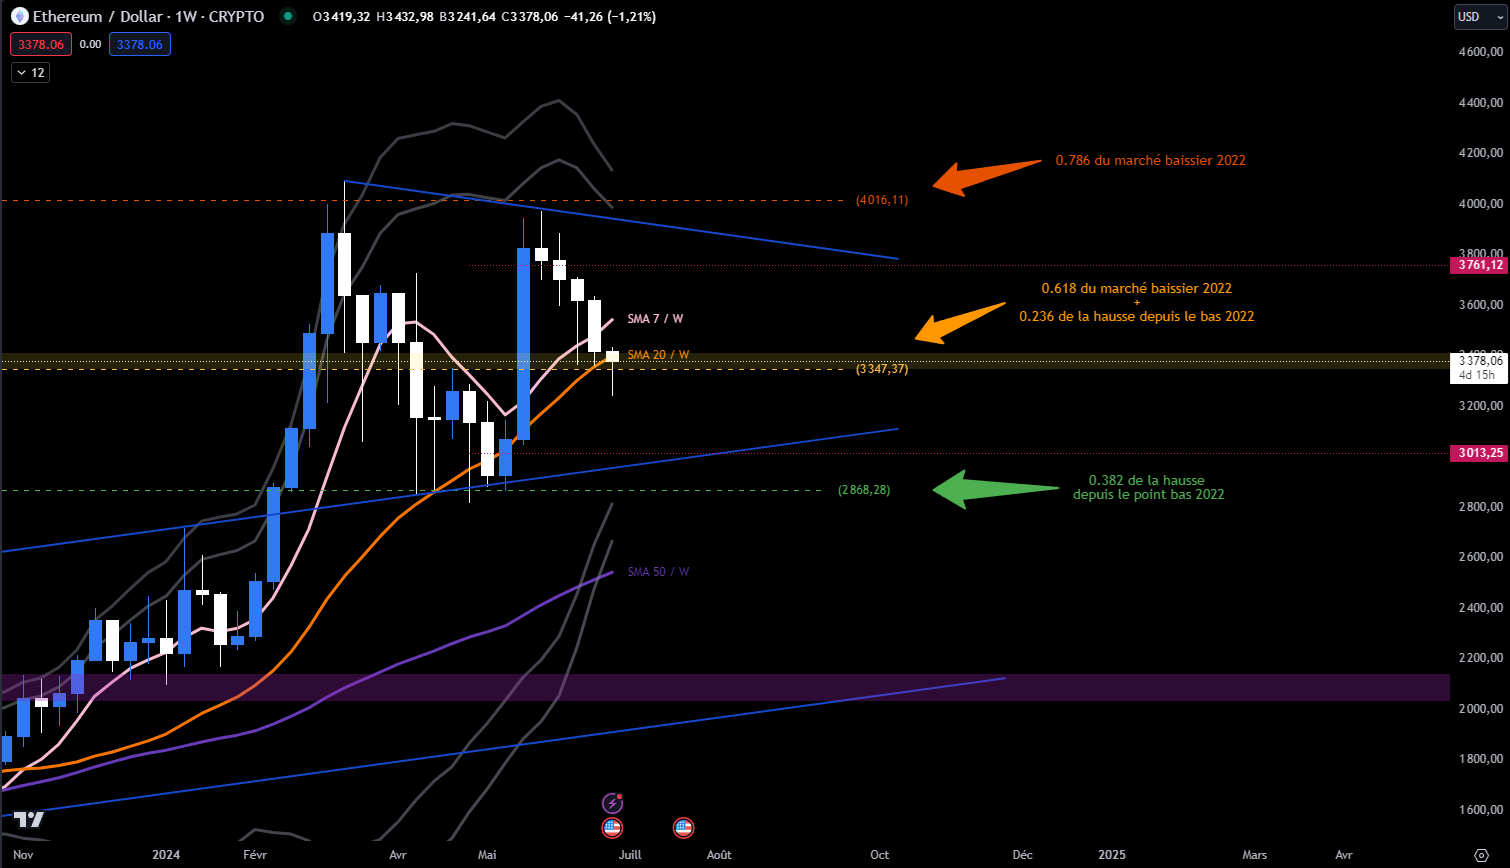
Ethereum’s ETH is currently working towards $3,400, a level that can easily be extended to a confluence zone between 3,350 and 3,450 dollars integrating many major technical elements:
- equilibrium of the compression zone and the May monthly candle;
- 0.618 Fibonacci retracement of the 2022 bear market which corresponds to the 0.236 rise from the lows;
- 20-week moving average.
If the preservation of this level argues in favor of a bullish consolidationthe challenge of the week remains to confirm the good reaction which is developing (absorption of liquidity) by closing at least in this pivotal zone. More distinctly, a close above $3,450 would point the way for a bullish recovery next week.
If applicable, closing below $3,350 would direct us towards a negative polarity with the objective of the lower limit of the compression zone between $2,800 and $3,000. The 50-week moving average remains a level we could reach in excess around $2,600.
While Ethereum’s fundamentals could lead to a sharp price reaction, lhe weekly Bollinger Bands are currently closing. They limit price action:
- to the south at the $2,600 to $2,800 zone, confluence with the 50-week moving average;
- north to the $4,000 to $4,100 zone.
Concretely, the market will not move out of this broad zone without a significant catalyst. Until then, volatility could be constrained step by step. Price action, polarized by the $3,400 level, would visit the upper and lower bounds of our working zone in turn.

Weekly ETH price chart
Join the Cryptoast community on DiscordETH still seeking renewed dominance in the medium term
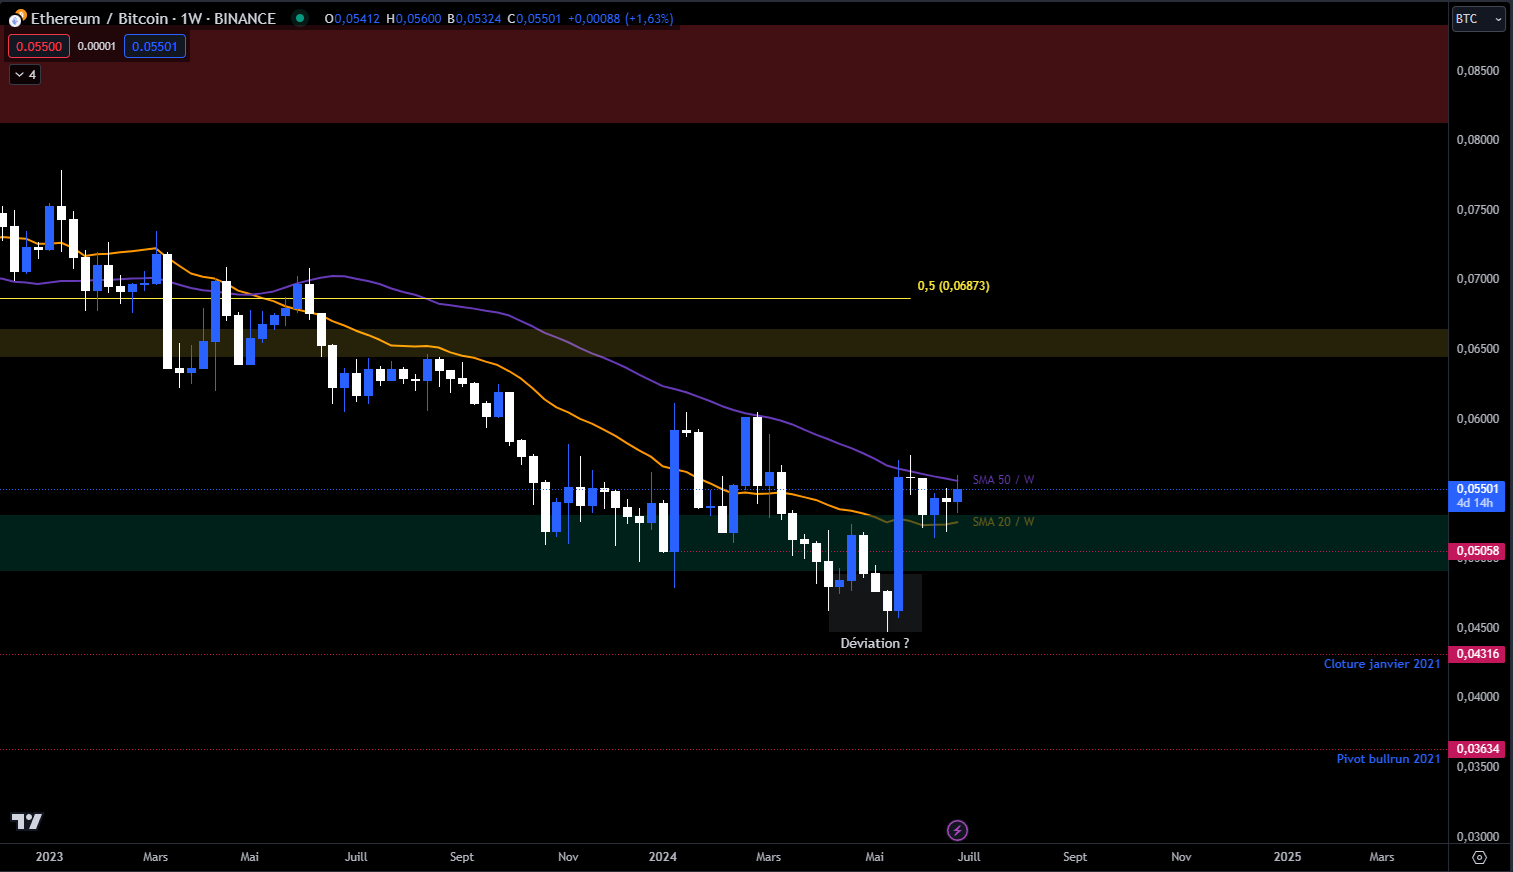
The situation is improving for Ethereum dominance. On a daily basis, the charts show a positive polarity, however, on a weekly basis, resistance remains to be overcome with a view to a more sustainable recovery.
In addition, the 50-week moving average is a barrier. It must be recaptured to give the first signals of a return to medium-term outperformance against Bitcoin.
In support, the green zone – particularly the lows of January 2024 – must not give up more ground at the risk of entering a continuation of this phase of underperformance. Closer to prices: crossing the 20-week moving average downwards would trigger a first alert.
 against BTC")
Weekly price chart of Ethereum against BTC
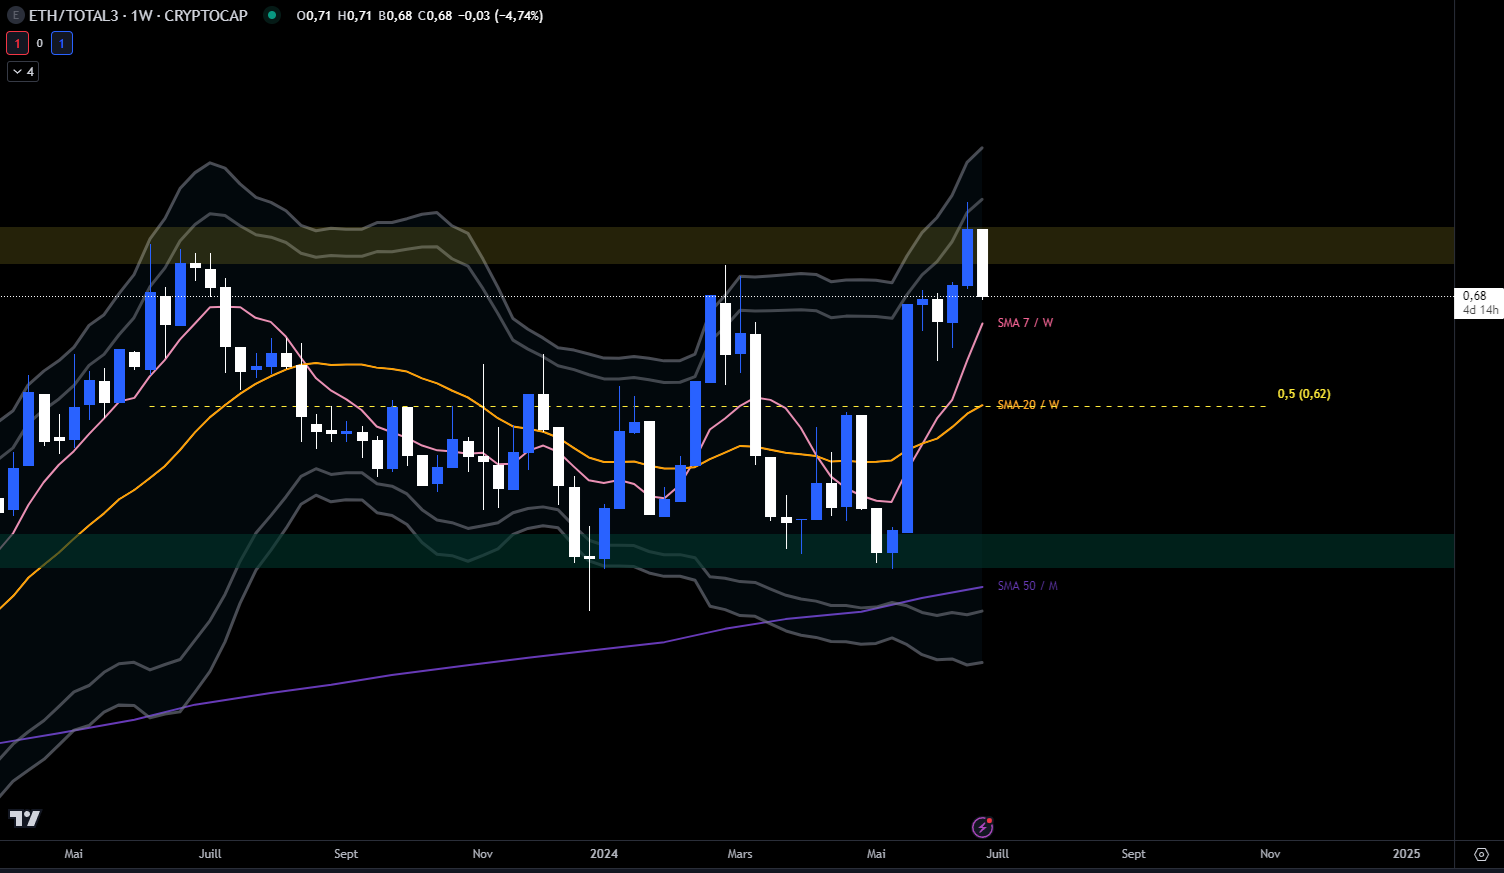
Against all altcoins, Ethereum’s chart rejects resistance in yellow. If this remains to be confirmed at the weekly close, reinstatement as it stands could lead to at least revisiting the 20-week moving average which enters into confluence with the equilibrium of the range. However, it is worth monitoring the 7-week moving average which could play a key role.
Indeed, Bollinger Bands appear to respond to price action by opening slightly. A medium-term bullish flow could develop for the ETH pair against altcoins (TOTAL3) if we manage to rebound soon and cross the yellow zone. If necessary, a return to the middle of the range at 0.62 is the preferred scenario.

ETH price chart against the altcoin market
Cryptoast Research: Don’t waste this bull run, surround yourself with expertsIn summary, Ethereum ETH is well entrenched in its long-term uptrend. The consolidation continues, marking great resilience and preserving key price levels with a view to bullish continuation in the coming weeks. The major polarity zone at $3,400 is the level that needs to be defended.
Against Bitcoin and the rest of the altcoins, Ethereum is working key resistances in search of outperformance. The objective is therefore to overcome these levels in order to attract capital.
So, do you think ETH can outperform the crypto market again? Don’t hesitate to give us your opinion in the comments.
Have a nice day and we’ll see you next week for a new technical analysis of altcoins.
Sources: TradingView, Coinglass, Glassnode
Newsletter 🍞
Receive a summary of crypto news every Monday by email 👌
What you need to know about affiliate links. This page may feature investment-related assets, products or services. Some links in this article may be affiliated. This means that if you buy a product or register on a site from this article, our partner pays us a commission. This allows us to continue to offer you original and useful content. There is no harm to you and you can even get a bonus using our links.
Investments in cryptocurrencies are risky. Cryptoast is not responsible for the quality of the products or services presented on this page and cannot be held responsible, directly or indirectly, for any damage or loss caused following the use of a good or service highlighted in this article. Investments related to crypto-assets are risky by nature, readers should do their own research before taking any action and only invest within the limits of their financial capabilities. This article does not constitute investment advice.
AMF recommendations. There is no guaranteed high return, a product with high return potential involves high risk. This risk-taking must be in line with your project, your investment horizon and your capacity to lose part of this savings. Do not invest if you are not prepared to lose all or part of your capital.
To go further, read our Financial Situation, Media Transparency and Legal Notices pages.

Analyst at Cryptoast Research for several years, I carry out in-depth monitoring of the crypto market to analyze the next narratives while keeping an eye on the financial markets.
Emmanuel Lazaro
29 items

Author Bio
A connoisseur of the digital marketplace and a master of the written word, this 30-year-old English expert brings to the table a wealth of knowledge rooted in the sale of digital products and a passion for blogging that resonates with an audience seeking expertise and insight in the online realm.
Their insights are drawn from hands-on experience navigating the intricacies of e-commerce and content creation—leading the forefront of digital innovation and communication. Whether it’s breaking down complex marketing strategies or sharing tips on how to captivate an online audience, their work stands as a testament to a career built upon successful digital engagement and savvy business acumen.
Stay tuned to absorb compelling content from a voice that not only understands the digital landscape but also shapes its future through every blog post and digital strategy.